


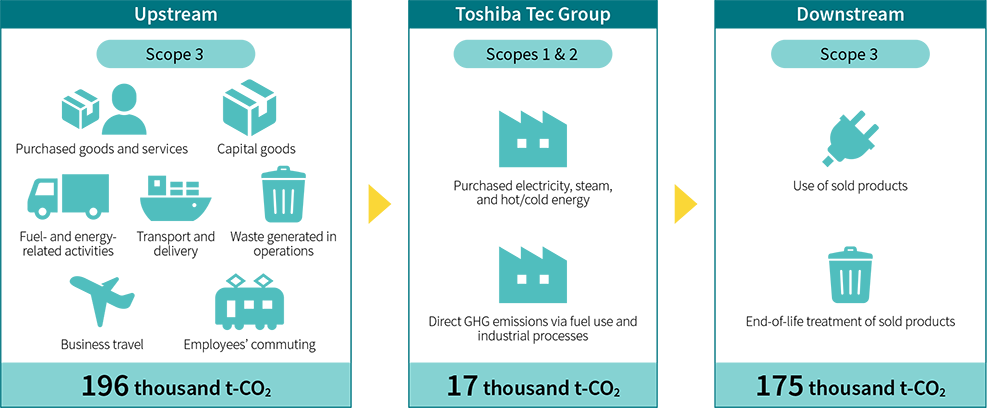
GHG Emissions in the Supply Chain
As climate change becomes an increasingly serious issue, companies must manage not only their own greenhouse gas (GHG)*1 emissions but also emissions generated across their entire value chain. Based on the GHG Protocol*2, which provides international standards for calculating GHG emissions, and the Ministry of the Environment's Basic Guidelines for Calculating GHG Emissions throughout the Value Chain, Toshiba Tec Group calculates indirect GHG emissions generated outside the scope of its own business activities (Scope 3) in addition to its own emissions (Scope 1 & 2) in accordance with Toshiba Group's Policy. Toshiba Tec Group will continue working effectively throughout product lifecycles by quantitatively analyzing emissions per category as described above.
- ※1CO2, CH4, N2O, HFCs, PFCs, SF6, NF3
- ※2The Greenhouse Gas Protocol (GHG Protocol): Guidelines for calculating and reporting GHG emissions formulated by companies, NGOs, and government organizations around the world under the leadership of the World Resources Institute (WRI) and the World Business Council for Sustainable Development (WBCSD)
| Classifi-cation | Category | FY2023 calculation results (thousand t-CO2) | FY2024 calculation results (thousand t-CO2) | Percent change in emissions | Remarks | |
|---|---|---|---|---|---|---|
| Upstream | 1 | Purchased goods and services | 123.3 | 116.8 | 95% | |
| 2 | Capital goods | 62.9 | 70.3 | 112% | ||
| 3 | Fuel- and energy-related activities not included in Scopes 1 & 2 | 6.0 | 2.6 | 43% | ||
| 4 | Transport and delivery (upstream) | 2.6 | 2.5 | 97% | ||
| 5 | Waste generated in operations | 0.2 | 0.2 | 96% | ||
| 6 | Business travel | 4.0 | 2.8 | 70% | ||
| 7 | Employees' commuting | 1.0 | 1.0 | 97% | ||
| 8 | Leased assets (upstream) | - | - | - | This category does not apply to Toshiba Tec Group's business. | |
| Toshiba Tec Group | 9 | Direct emissions (Scope 1) | 3.7 | 2.6 | 72% | |
| 10 | Indirect emissions from energy use (Scope 2) | 34.1 | 14.6 | 43% | The figures include contribution based on green certificates. | |
| Downstream | 11 | Transport and delivery (downstream) | - | - | - | This category does not apply to Toshiba Tec Group's business. |
| 12 | Processing of sold products | - | - | - | This category does not apply to Toshiba Tec Group's business. | |
| 13 | Use of sold products | 163.3 | 170.3 | 104% | ||
| 14 | End-of-life treatment of sold products | 4.2 | 4.2 | 100% | ||
| 15 | Leased assets (downstream) | - | - | - | This category does not apply to Toshiba Tec Group's business. | |
| 16 | Franchising | - | - | - | This category does not apply to Toshiba Tec Group's business. | |
| 17 | Investment | - | - | - | This category does not apply to Toshiba Tec Group's business. | |
| Total | 405.3 | 387.9 | 95% | |||
Target sites: Toshiba Tec Head Office, Shizuoka Business Center, 1 domestic and 2 overseas manufacturing group companies
Corporate Data
-
- Topics
- CEO Message
- Message from Chief Sustainability Officer
- Toshiba Tec Group Sustainability Policy and Materiality KPI
- Special Feature SDGs x Toshiba Tec
- Environment
- Social
- Governance
- Feature: 5-Minute Guide—Toshiba Tec CSR Activities
- Integrated Report